How much time do you spend creating an “area map” for your air quality permit application or dispersion modeling submittal? The short answer is too much.
The purpose of providing an area map is to provide to the regulator (and the public) information about where the proposed permitted site is or will be and what the surroundings are particularly residential developments, schools, churches, and other industrial areas.
Below is what most air quality permit applications and modeling reports include.
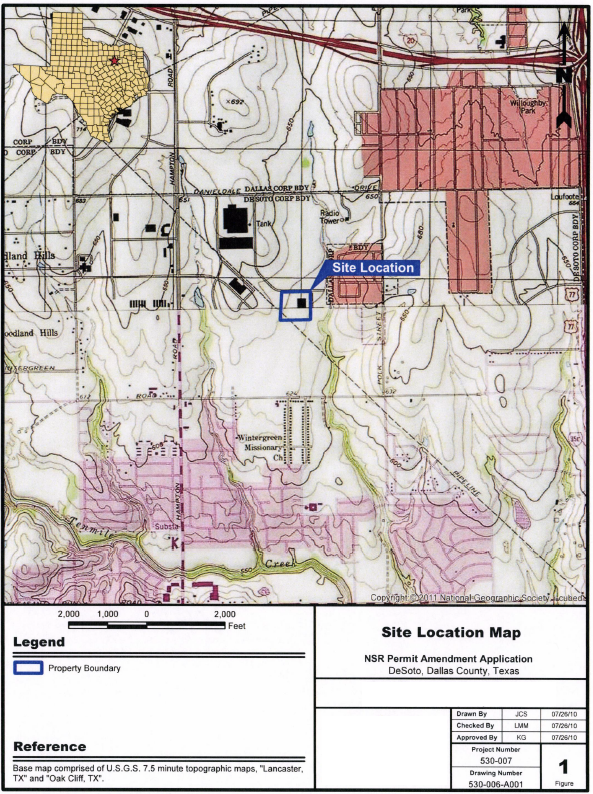
This should look very familiar to those that prepare permit applications and modeling reports. However, the usefulness of this area map, and nearly all others like it, is nil. Besides seeing what part of Texas this site is in, there is no information to be gleaned from it. More importantly, this “area map” took about an hour or two for someone to put together and a few hundred dollars for the client to pay for that effort.
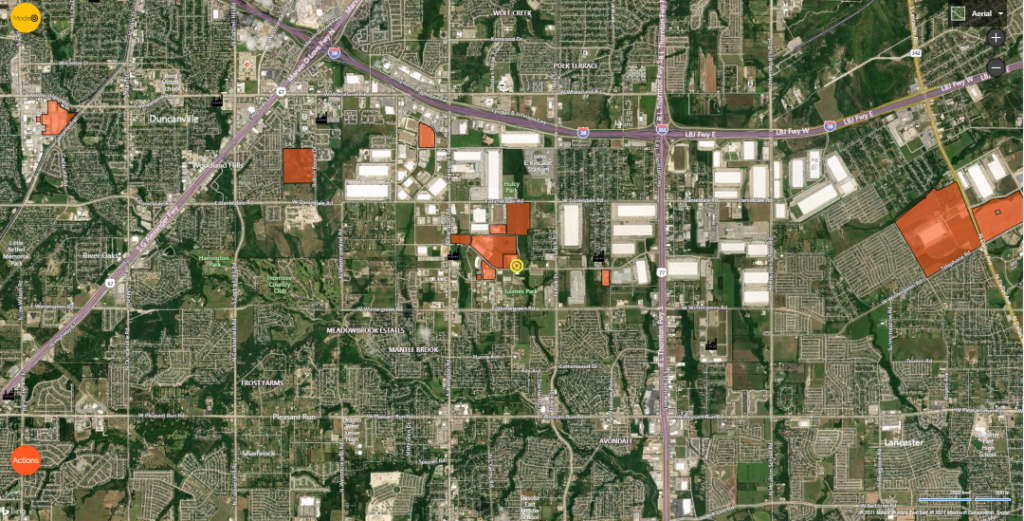
We are proposing an alternative that is much more useful. Below is the same area, but with a different representation of how the area actually looks. Quite a difference.
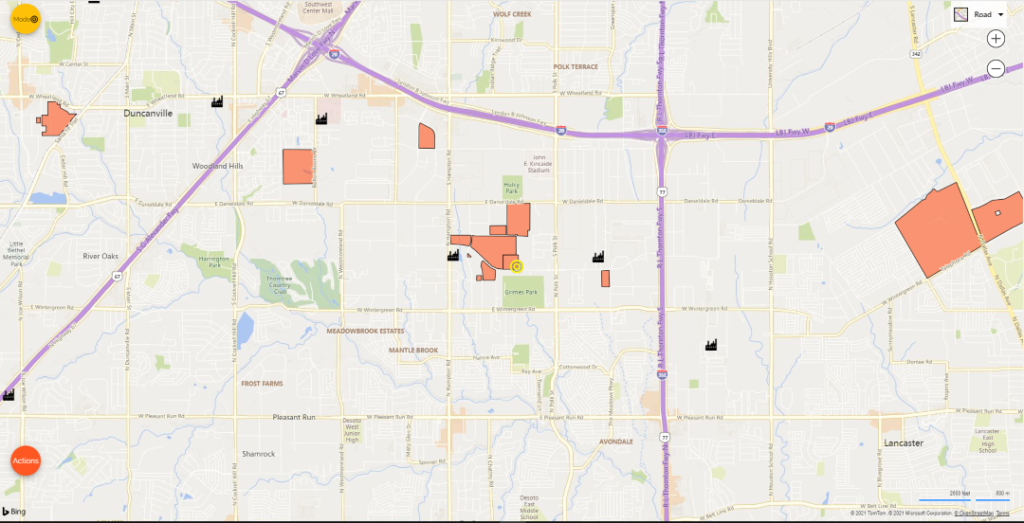
If you don’t like the aerial imagery, how about a street map view?
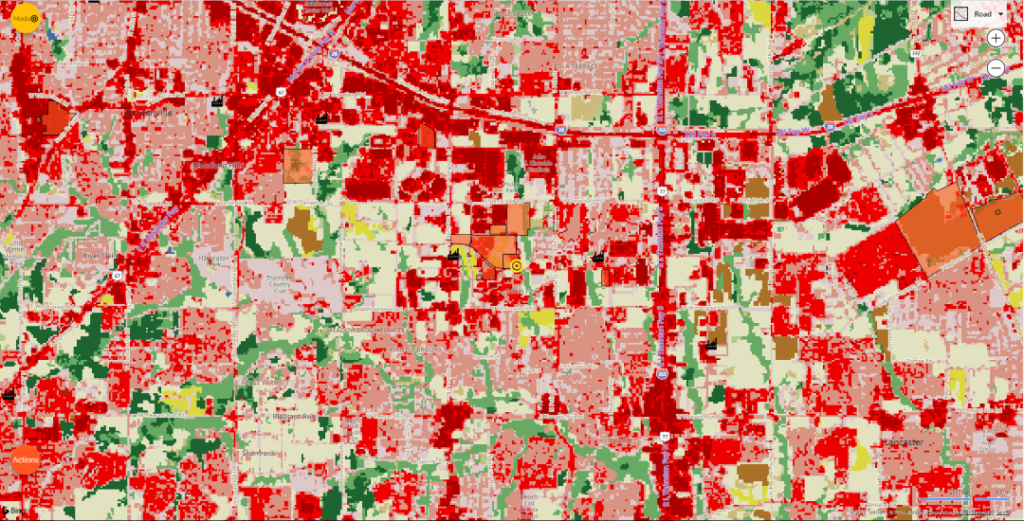
How about a land use map as background?
If schools need to be shown, that can be done too, along with a 3 km X 3 km square around the site.
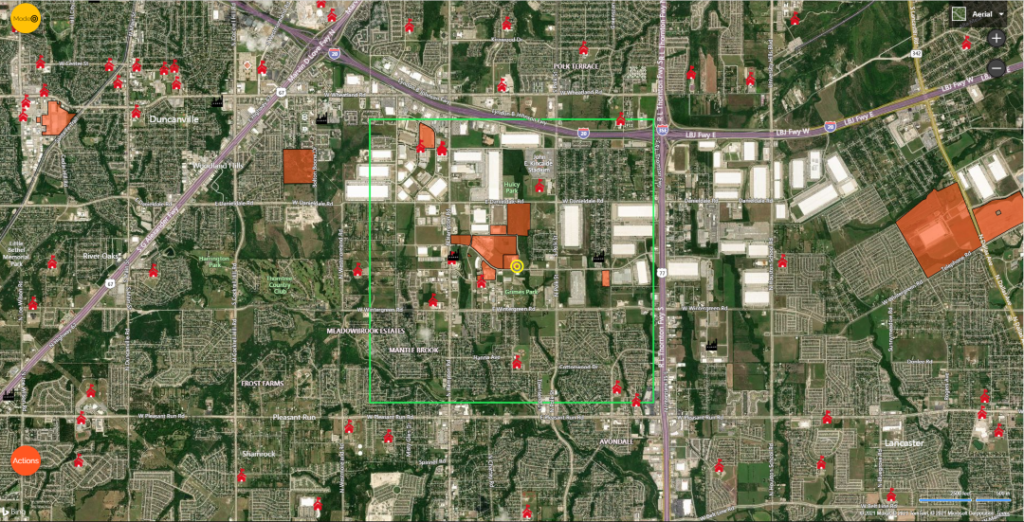
Do you want a breakdown of Urban v. Rural land cover for the area (3 km X 3 km area)? We can do that too and provide a PDF for documentation.
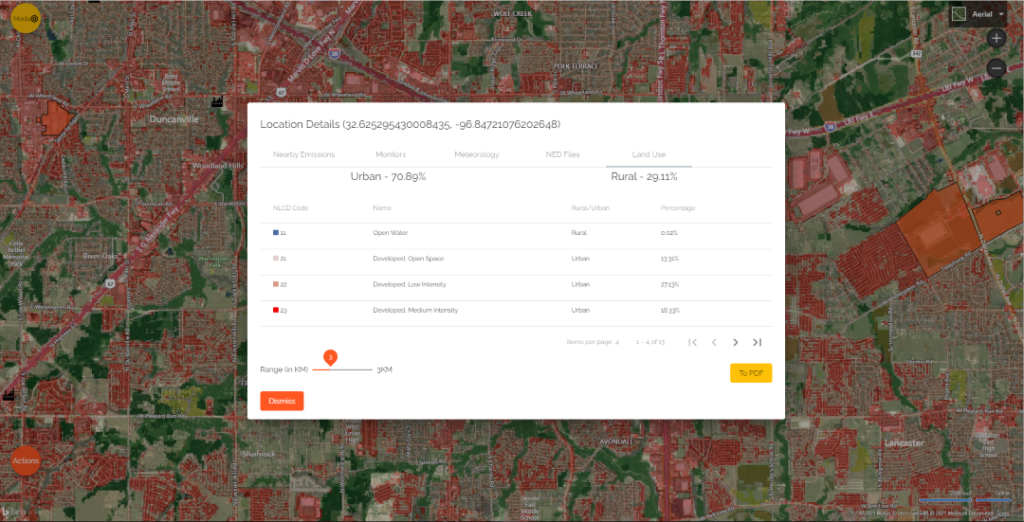
How much time did it take to generate these four alternative area map? About a minute.
Stop wasting your time on useless area maps. Go to https://nk20.naviknow.com/ (NaviKnow Tools), open a user account, and create high-quality area maps that actually convey useful information.
NaviKnow Tools is a powerful resource for air quality permitting, regulatory strategy, and dispersion modeling. Creating an area map is the least of its powers. Explore all of the available datasets for free.
Have questions about NaviKnow Tools? Email us at [email protected].