When I was in graduate school, I attended a graduate seminar on design optimization algorithms. The case study presented was on design improvements of the structural components of a minivan. The inputs into the algorithms were the current minivan design and all the criteria for required regulatory and industry design constraints, standards, and rules and material and manufacturing cost considerations.
After this “model” chugged away and iterated to the optimized design, the presenter showed the new design. It didn’t look much different from the current design. The presenter did made it a point that, though the optimal design did look remarkable similar to the current one, the big difference was the new design had 10% fewer components. With fewer components, it was cheaper to manufacture and had fewer things to break or go wrong.
Think about what goes into a dispersion modeling project. There is one spreadsheet with source locations and parameters. Another spreadsheet with emission rates. You need information on buildings and significant structures. Don’t forget meteorological data files, terrain data, and land use data. There are lots of chances where something can be mis-entered, mis-copied, or just missed altogether.
With a database centric approach to dispersion modeling, there are fewer parts and the ability to establish and enforce data quality rules. It is just simpler and better than the current file-based paradigm.
One Database. One Connection. One Simple Solution.
In this article, we will describe just one way you can integrate a simple dispersion modeling project database into your workflow. We don’t want to scare anyone by saying you need to replace your entire workflow. We would like you to try it out on something that is relatively simple; analysis of the model results.
If your office has access to a GIS platform, like ArcGIS, there are a few steps you can take, provided you have a simple dispersion modeling project database, that will save many hours of headache and aggravation copying, reformatting, and editing data.
If you read our article on putting a simple modeling database together (http://www.naviknow.com/2018/08/15/using-databases-with-dispersion-modeling-putting-it-all-together/) and followed through on building your database, then you already have the data tables to get started.
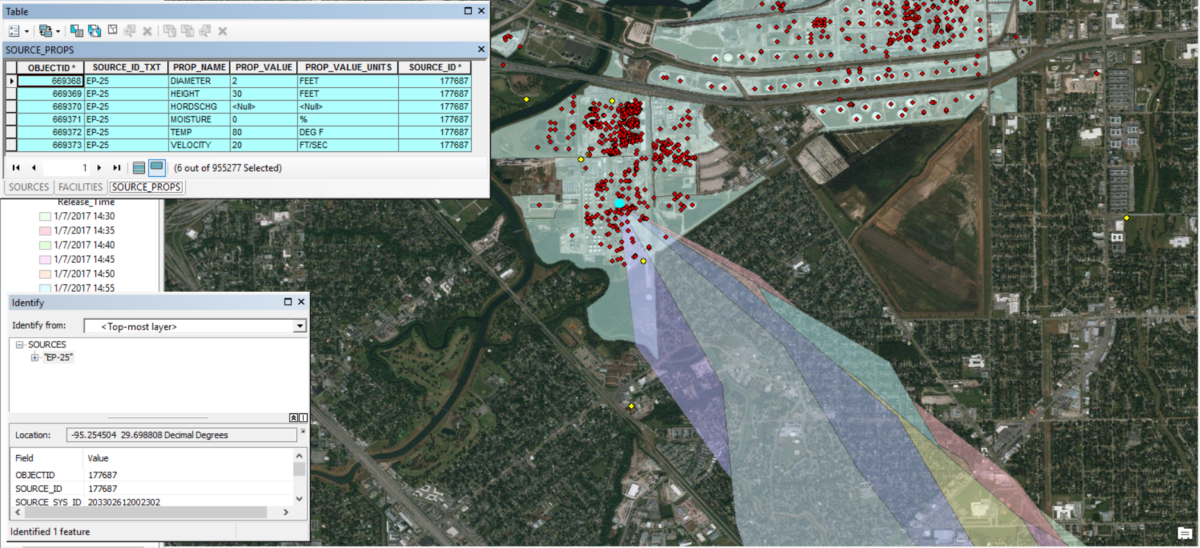
To create a connection between your modeling project database and ArcGIS, view the video below. The connection allows ArcGIS to have direct access to the data you want to display, e.g. sources, receptors, or modeling results. No need to copy, reformat, or edit your data once in your data source and once again in ArcGIS. When you make a change in your modeling project database, if you have ArcGIS open at the time of the change, you merely refresh the display. Otherwise, the changes are there when you open ArcGIS again.
Though the data in your modeling project database are accessible to ArcGIS, they are in tabular form. Each table in the database provided by NaviKnow (go to https://learn.naviknow.com/p/using-databases-with-dispersion-modeling/ and enroll in the free class to download an Access database), has an x-coordinate, y-coordinate, and coordinate system data field. ArcGIS gives you the ability to plot tabular data provided you supply the X and Y coordinate fields for the data table and the coordinate system of the locations. The next video shows the steps to plot your modeling data and develop a reusable symbology template to analyze your modeling data at a glance.
If you prefer following written instructions, follow the link under Resources at the end of this article for the very same steps followed in the videos.
Summary
Displaying and analyzing your modeling results should be a simple and straightforward task. By housing your results in a database and creating a connection to those data to your GIS platform, it is a simple and straightforward task. We have shown you the steps to go through to set up your data and connections so all the work need only be done once.
If you found this article informative, there is more helpful and actionable information for you. Go to http://learn.naviknow.com to see a list of past webinar mini-courses. Every Wednesday (Webinar Wednesday), NaviKnow is offering FREE webinar mini-courses on topics related to air quality dispersion modeling and air quality permitting. If you want to be on our email list, drop me a line at [email protected].
One of the goals of NaviKnow is to create an air quality professional community to share ideas and helpful hints like those covered in this article. So if you found this article helpful, please share with a colleague.
