I have never played the blame game when things don’t go as expected. When it comes to dispersion modeling and the predicted concentrations are too high to be acceptable, then I do want to know what the causes are so they can be addressed.
If you are using AERMOD, you could use the EVENT model options to diagnose which sources are contributing the most to the overall maximum predicted concentrations. However, to run the EVENT options, you kind of need to know what, where, and when the problems are in advance. You will need to re-run the model to get your answers and that take time. Wouldn’t it be better if you knew ahead of time which sources are contributing most without having to execute additional model runs?
How to Minimize the Number of AERMOD Runs
In our article Save Time and Effort with Unitized Dispersion Modeling (http://www.naviknow.com/2018/04/18/unitized-dispersion-modeling/), we demonstrate, if your modeling project includes evaluating dozens of air contaminants from dozens of sources, by setting up one model run, your model results will report the unitized concentrations for each source separately. By applying the emission rates for each source, air contaminant by air contaminant, you can produced air contaminant specific results. You can use the very same technique to determine source culpability.
Step 1
Use a unit emission rate for each source, either 1 lb/hr or 1 g/esc.

Step 2
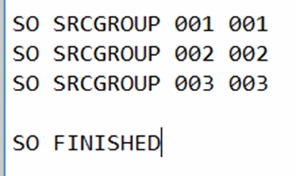
Create source groups such that there is one source per group.

Step 3
Report results for each group to (a single, preferred) file using the PLOTFILE option.

Step 4
Set up the project emission rates and PLOTFILE results so the emission rates (source by source and air contaminant by air contaminant) can be applied to the unitized concentrations. We highly recommend you use a database program.

Step 5
Calculate the source specific contributions and the maximum predicted concentration (GLCmax) for all sources.
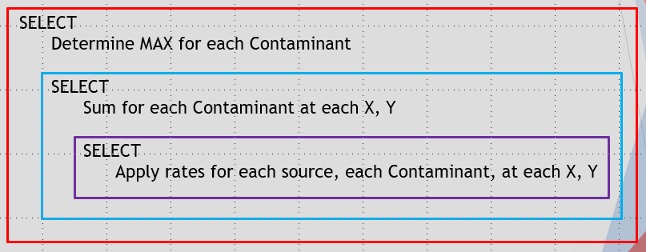
For the GLCmax calculation, the query to perform that is structured something like this:

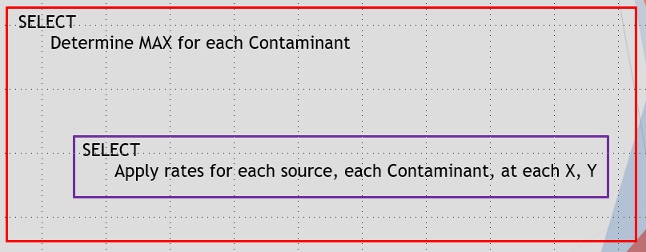
There is a query that applies the emission rates nested inside a query that adds the contribution for each source nested inside a query that finds the overall maximum. This is fine if you are looking for the overall GLCmax. To get the individual source contributions, just leave out the middle nested query like so:

If you are preparing air contaminant specific model runs, you would skip step 1 above, but then following the very same procedure.
Summary
We have shown, by being proactive and setting up your model input files up front, you can determine which sources are contributing the most to the GLCmax value and to what extent they are contributing. By following these steps, you will save yourself time and effort.
If you found this article informative, there is more helpful and actionable information for you. Go to http://learn.naviknow.com to see a list of past webinar mini-courses. Every Wednesday (Webinar Wednesday), NaviKnow is offering FREE webinar mini-courses on topics related to air quality dispersion modeling and air quality permitting. If you want to be on our email list, drop me a line at [email protected].
One of the goals of NaviKnow is to create an air quality professional community to share ideas and helpful hints like those covered in this article. So if you found this article helpful, please share with a colleague.
