If you do chose to use land use data from the USGS that is more recent than 1992 (NLCD for 2001, 2006, 2011, and 2016), be aware that the classification schema for the newer data is slightly different. The table below shows the mapping for the classification codes.
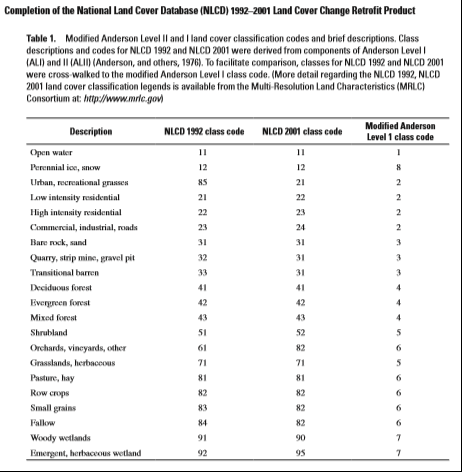
Though it is import to know the mapping of the 1992 codes to the more recent codes, you should also be aware of the surface characteristic values (for Albedo, Bowen ratio, and roughness length) associated with the new codes and whether those values make sense, particularly for surface roughness length.
Where Did Roughness Values Come From?
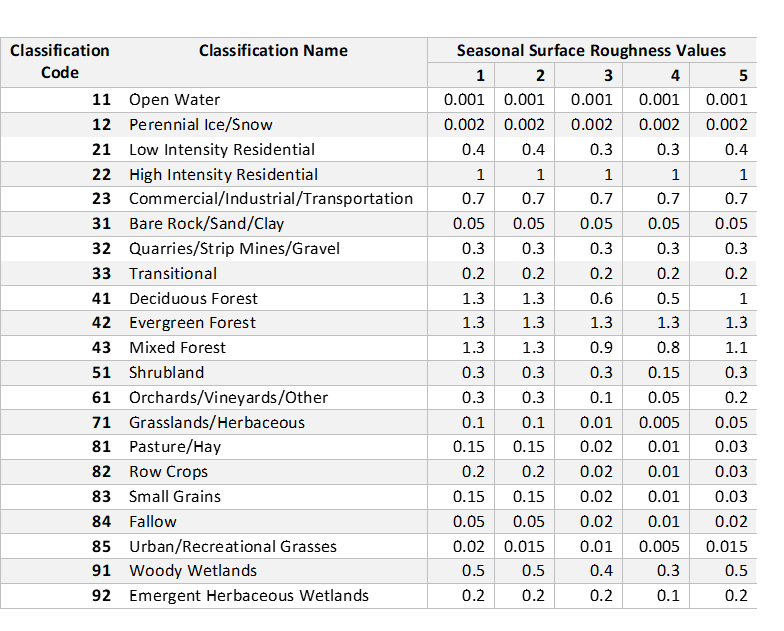
We are all familiar with the surface characteristic value tables in the appendices of the AERSURFACE User’s Guide, like the one for roughness length listed below.
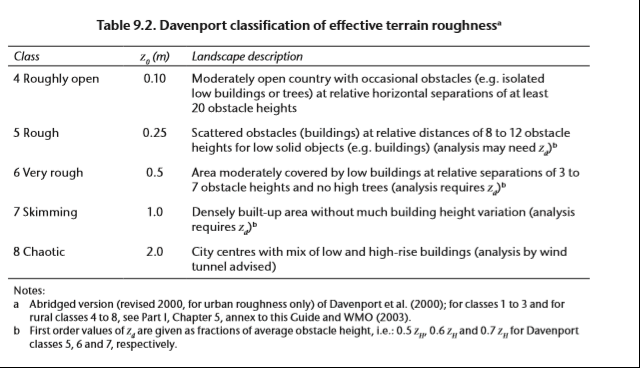
Do you know the source of all these values? If you are old enough to remember using the Industrial Source Complex (ISC) dispersion model, you will remember PCRAMMET, the meteorological processor for ISC. PCRAMMET also had the ability to use surface characteristics. The table of values was a bit more simple.
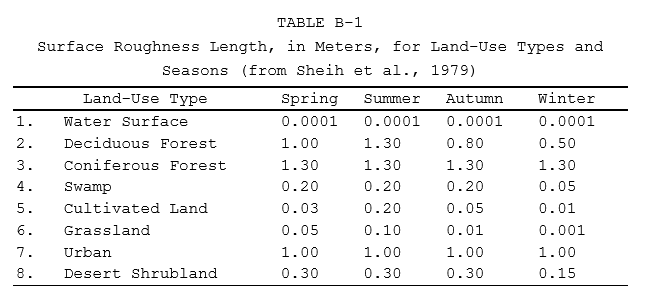
Notice the are only eight classifications in the original data source compared to the 20-21 for the NLCDs. One thing that sticks out to me is the original data source has only one flavor of urban while the NLCDs have four.
The roughness values used with AERSURFACE sort of make sense, in that urban areas are not homogeneous. Some areas are open areas, other with some structures and pavement, and more with more and larger structures and nearly completely covered with concrete or asphalt. As the number and size of structures and amount of impervious ground increases, you would think the roughness length would increase, as well. Right?
Roughness Length and Meteorological Observations
In the WMO Guide To Meteorological Instruments and Methods of Observation (the CIMO Guide) WMO-No. 8 (2014 edition, Updated in 2017); Chapter 9: Urban Observations, urban development has been broken down into classes of urban intensity and impact on local meteorology. See the tables from the CIMO Guide below.
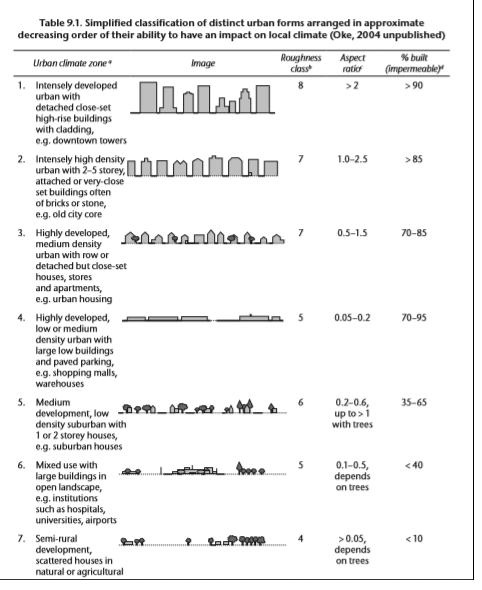
It is clear from the values and descriptions in the CIMO Guide, more and larger structures would account for a larger value of surface roughness length. This leads me to question the appropriateness of the roughness length values for land use classification code 23 for NLCD 1992 (code 24 for NLCD 2001 to present) in the AERSURFACE User’s Guide. Why does the roughness length decrease when the classification code goes from 22 to 23 for NLCD 1992 (23 to 24 for NLCD 2001)? Shouldn’t the value go up?
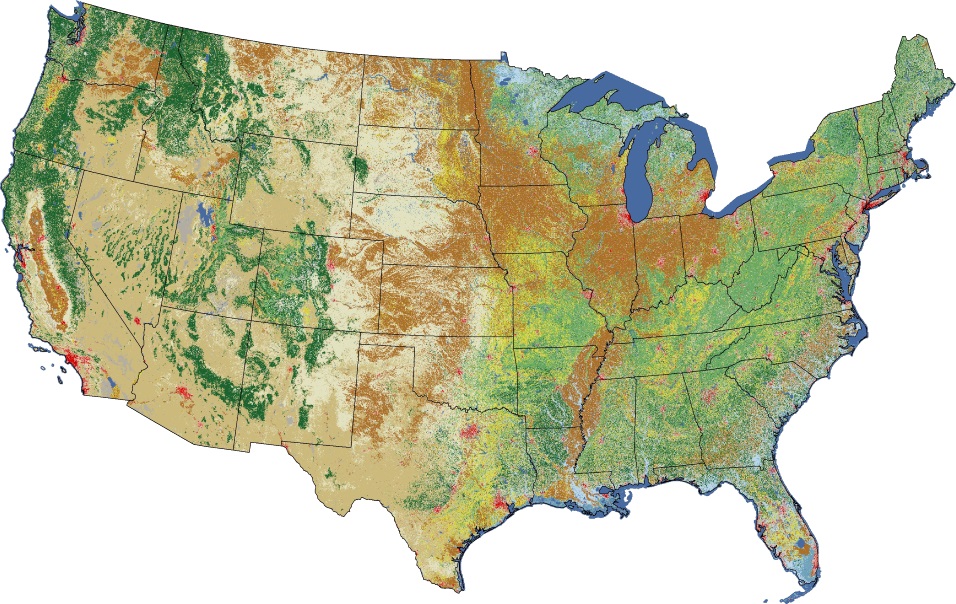
Looking At The Land Cover Classifications
Below is a side-by-side comparison of the land use category descriptions between NLCD 1992 and the more recent NLCDs. Using the code values from the Land Cover Change Retrofit values, the description seem to line up for the most part. The first two sets of descriptions appear comparable, but the last two sets seem to be partially consistent and inconsistent. The 1992 descriptions appear to go from open spaces, to low density residential, to higher density residential, to industrial, while the 2001 descriptions go from open spaces, to sparse residential, to more dense residential but still single-family housing, to very urbanized and industrial.
Comparison of Land Use Classification Descriptions
| NLCD 1992 | NLCD 2001 and following |
| Class Code 85 – vegetation (primarily grasses) planted in developed settings for recreation, erosion control, or aesthetic purposes. Examples include parks, lawns, golf courses, airport grasses, and industrial site grasses. | Class Code 21 – areas with a mixture of some constructed materials, but mostly vegetation in the form of lawn grasses. Impervious surfaces account for less than 20% of total cover. These areas most commonly include large-lot single-family housing units, parks, golf courses, and vegetation planted in developed settings for recreation, erosion control, or aesthetic purposes. |
| Class Code 21 – areas with a mixture of constructed materials and vegetation. Constructed materials account for 30% to 80% of the cover. Vegetation may account for 20% to 70 % of the cover. These areas most commonly include single-family housing units. Population densities will be lower than in high intensity residential areas. | Class Code 22 – areas with a mixture of constructed materials and vegetation. Impervious surfaces account for 20% to 49% percent of total cover. These areas most commonly include single-family housing units. |
| Class Code 22 – areas highly developed where people reside in high numbers. Examples include apartment complexes and row houses. Vegetation accounts for less than 20% of the cover. Constructed materials account for 80% to100% of the cover. | Class 23 Code – areas with a mixture of constructed materials and vegetation. Impervious surfaces account for 50% to 79% of the total cover. These areas most commonly include single-family housing units. |
| Class 23 Code – areas of infrastructure (e.g. roads, railroads, etc.) and all highly developed areas not classified as High Intensity Residential | Class 24 Code – highly developed areas where people reside or work in high numbers. Examples include apartment complexes, row houses and commercial/industrial. Impervious surfaces account for 80% to 100% of the total cover. |
Though the classifications are very broad, do remember that the resolution of the data is 30 meters. It is one thing to take a large area and classify it broadly, as the descriptions imply, but it is quite another if the classifications are assigned for each 30 meter by 30 meter parcel of land. So an area like an airport may be conceived as one large classification, in reality it is made up of open spaces and more urbanized pieces 900 square meters at a time.
An example of what I mean is in the following two images. Both are of the same tank farm but one is a photographic image and the other the land cover codes.
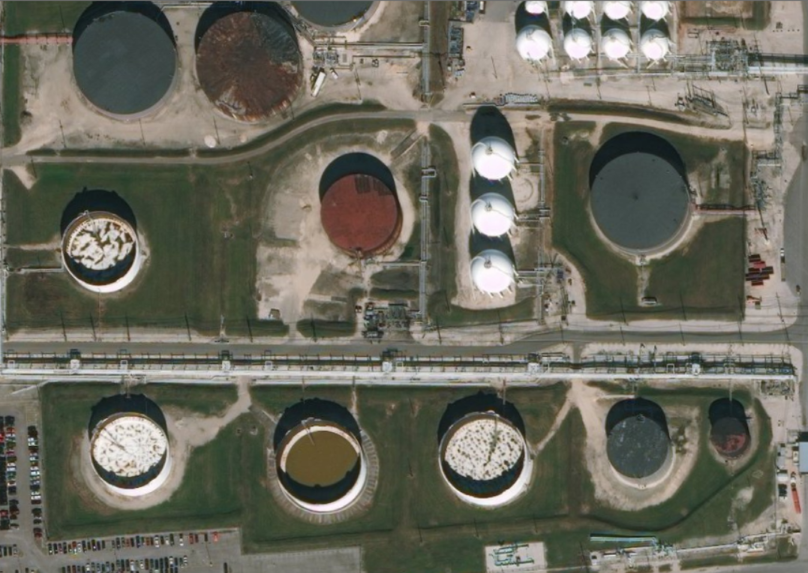

When looking at the first image as a whole, the area is definitely industrial (23 or 24), but when broken down by 30 meter squares, the area has open spaces all the way up to the most urban classification.
What Should The Appropriate Roughness Length Be?
In looking at all the information presented thus far, I have the opinion that the roughness value for classification code 23 in the AERSURFACE guide should be greater than it is and greater than the value for code 22. It really does not make much sense when a densely populated area of single family houses has a higher roughness length than an area with office buildings and high rise apartments.
The Proposal
Based on all the information and analysis above, I am making the following proposal:
For Classification code 23 for NLCD 1992 and the corresponding classification code 24 for NLCD 2001 and newer, the associated roughness length to use is 1.5 meters.
Please provide any comments or questions you have regarding the analysis and whether you believe the 1.5 meter roughness length is well justified. We really want to know what you think.
If you found this article informative, there is more helpful and actionable information for you. Go to http://learn.naviknow.com to see a list or past webinar mini-courses. Every Wednesday (Webinar Wednesday), NaviKnow is offering FREE webinar mini-courses on topics related to air quality dispersion modeling and air quality permitting. If you want to be on our email list, drop me a line at [email protected].
One of the goals of NaviKnow is to create an air quality professional community to share ideas and helpful hints like those covered in this article. If you found this article helpful, please share with a colleague.